What is included with IBM Planning Analytics on Cloud?
A typical IBM Planning Analytics solution includes two separate cloud environments or systems: one for non-production and one for production purposes. Your organisation might choose to subscribe to optional components, such as Cognos Analytics. It might also subscribe to more non-production and production environments.
The Planning Analytics standard system includes the following main components:
- Planning Analytics Workspace
- Secure Gateway for data integration with on-premises ODBC data sources
- TM1 Server
- TM1 hosted and local applications
- Planning Analytics system shared folder
- IBM Cognos Analytics (optional, not available with Planning Analytics Digital Pack)
- IBM Watson Analytics for self-service analytics, to uncover new insights into opportunities and risks automatically from data.
(Not available with Planning Analytics Digital Pack)
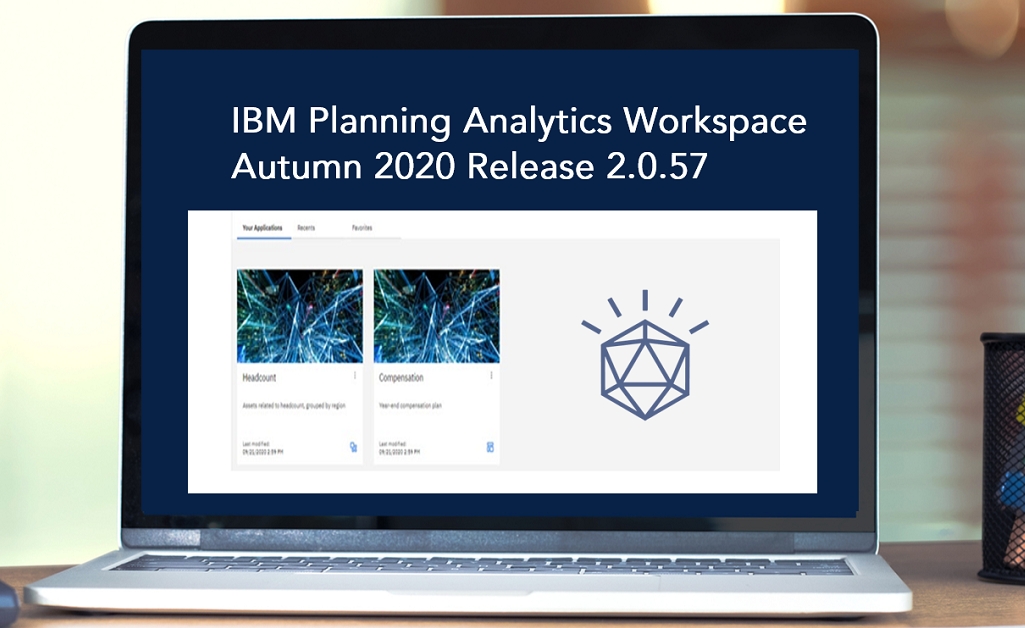
IBM Planning Analytics Workspace — the interface that revolutionises TM1
IBM Planning Analytics Workspace is the customisable user interface that is the new face of IBM TM1. It enables users to combine data from any cube in any IBM TM1 database into a single view, using a viewer, websheets, charts or cell widgets. No time-consuming data conversion is necessary.
Workspace coordinates three forms of data selectors: tile, list and slider. It enables report authors and consumers to intuitively filter data-rich “books” using buttons to navigate across content, carrying the context along as needed.
Workspace supports analysis, reporting and write-back with an interactive viewer, which makes it easy to navigate multi- dimensional cubes and convert “data exploration” into charts you can use for presentations and to share results with others. Workspace is also mobile, so you can work with Workspace books at your convenience, on an iPad or other tablet device.
Visualisations that bring insights to life
Workspace features a highly visual, freeform design that offers more than 25 different graphics, including charts, maps, scorecards, images and shapes, plus text and video. These automated visualizations help you create vivid, impactful reports to share insights with decision makers. Quick searching and Snap Commands give the interface a natural-language-like feel.
Hierarchies allow more flexible analysis
The “hierarchies” capability in IBM Planning Analytics provides both technical advantages and business-user benefits. With hierarchies, you’re not limited to the traditional definition of cubes. You can perform more in depth, granular analysis using “attributes” to describe the characteristics of customers, products, projects, sales programs and more. Attribute data can be leveraged seamlessly in the form of “virtual dimensions” using data that existed at the time the cube was created or introduced later on.
Virtual dimensions offer benefits including:
- More dynamic hierarchies, since attributes change over time
- Less ongoing maintenance
- Faster calculation, thanks to smaller cube size
- Ad hoc hierarchies can be created and immediately introduced into Excel, web or mobile for quick, convenient analysis
You can also see the intersections of several hierarchies within the same dimension, enabling you to drill down to find data points never before possible. In addition, hierarchies can be used for dimension reorganisation and versioning and be implemented through an intuitive process with little setup needed.
IBM Planning Analytics for Microsoft Excel
Users can explore and analyse data sourced from multidimensional planning models within the familiar Excel interface using IBM Planning Analytics for Microsoft Excel. This add-on lets you retain full Excel functionality and formatting, including graphing and built-in functions, while enjoying all the capabilities of a modern planning and analytics solution.
IBM Planning Analytics for Microsoft Excel is the successor to IBM Cognos Analysis for Microsoft Excel (CAFE). It provides Excel access to the IBM TM1 database with superior performance over wide-area networks. It integrates smoothly with Workspace, and both environments share a common UX, cube viewer and set editor.
IBM Planning Analytics for Microsoft Excel has four models of interaction:
- Exploration for slice/dice/pivot analysis
- Quick reports for fast worksheet design
- Dynamic reports for row interactivity (zero suppression, expand, collapse)
- Custom reports for highly formatted forms and reports
All reports created in IBM Planning Analytics for Microsoft Excel can be published for websheet consumption in Workspace.
Deploy on cloud — without a lengthy migration process
The upgrade from IBM TM1 to IBM Planning Analytics on cloud does not require a lengthy migration process. ICit Consultants can guide you through the process – being recognised as cloud migration experts by IBM and awarded IBM Worldwide Innovative Solutions on Cloud Partner of the Year 2016.
An upgrade designed around your needs
IBM Planning Analytics provides a unified web, Excel, and mobile experience for all user roles and gives your organisation the capabilities you need to compete successfully in today’s constantly changing, frequently disrupted business environment. If you’ve realised value from IBM TM1, but want to simplify the IT infrastructure, then IBM Planning Analytics Cloud is the answer.