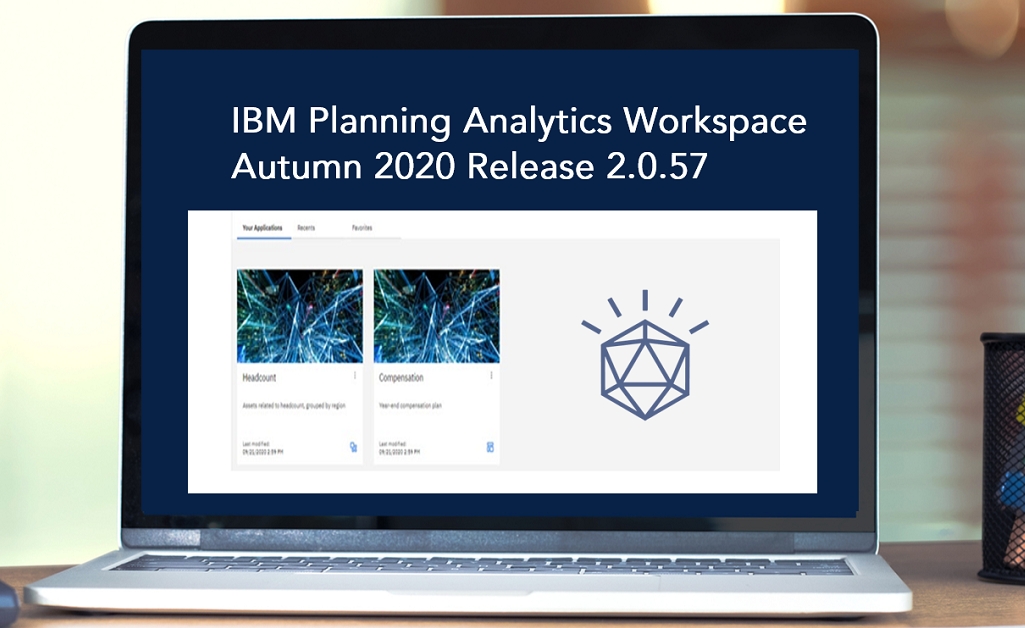
IBM Planning Analytics Workspace – Autumn 2020 Release 2.0.57
There are significant changes in Planning Analytics Workspace 2.0.57; from a completely revised interface to significant new features like forecasting.
- Improved look and feel
The Planning Analytics Workspace user interface has been updated to make it easier to accomplish tasks, provide a more consistent experience with other IBM products, and to simplify the transition between Planning Analytics Workspace and Cognos Analytics.
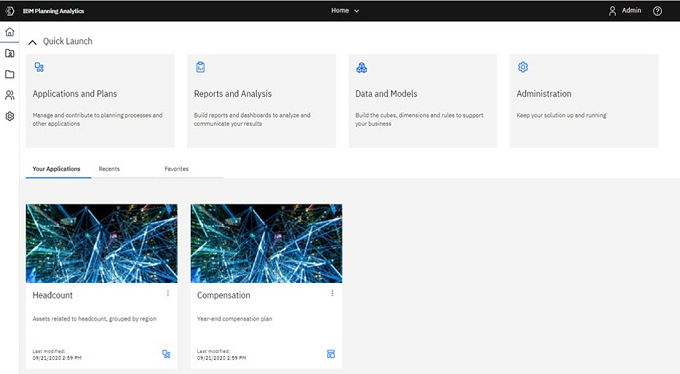
A new Home page for Planning Analytics Workspace is the first significant changes you’ll notice. On the new Home page, you can quickly access the area you want to work in, customized for your role within Planning Analytics Workspace. You can also quickly open your applications and plans, as well as your recent and favourite items.
- Applications and Plans
Applications and plans let you organise related Planning Analytics Workspace assets such as books, view, and web sheets in containers. - Administration page changes
The Planning Analytics Workspace Administration page has been reorganized to provide greater insight into your environment and to simplify access to administrative tasks. - Forecasting
You can now use forecasting in IBM Planning Analytics Workspace to discover and model trend, seasonality, and time dependence in data. - Book and visualisation improvements
The properties available to manage all aspects of your books have been significantly expanded. The visualization types available to use in Planning Analytics Workspace have been updated to provide more and improved visualisations. - Ask for help in the cognitive Learn pane
If you want to learn more about how to use Planning Analytics Workspace, click the Help icon (?) and ask a question. The cognitive help tailors your help experience based on where you are working in the product and finds only the answers that are relevant to your user role. You can find the latest videos, blogs, and documentation.
Forecasting feature explained
You can now use forecasting in IBM Planning Analytics Workspace to discover and model trend, seasonality, and time dependence in data, even if you are not familiar with time series modelling.
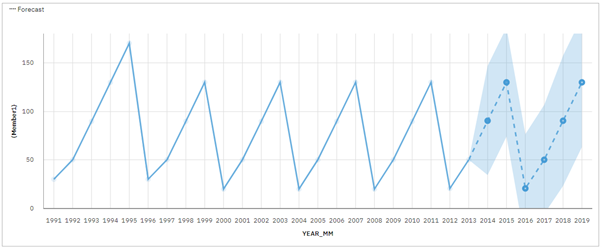
Forecasts and their confidence bounds are displayed in visualisations as a continuation of historic data. You can also view the statistical details for generated models if you want to see the technical background.
The following example shows forecasting values and confidence bounds in a line visualisation.
Specifying time series in forecasts often requires data manipulation. Planning Analytics Workspace supports a wide range of time series without the need for manipulation, ranging from standard date and time types, to nested periodic and cyclical time fields. When data is recognised as a time series, data preparation is automated. Appropriate trend and seasonal periods are detected, and models are selected from a set of nine different model types.
You can forecast in line, bar, and column visualisations. Forecasting allows analysis of hundreds of time series per visualisation. Forecasts and confidence bounds are computed for each time series and displayed in the visualisation as extensions of the current data. You can inspect each time series separately, and tailor the forecast and results to your own data and requirements.
If you are familiar with forecasting models, you can view the selected model type, estimated model parameters, standard accuracy measures, and processing summary information.

